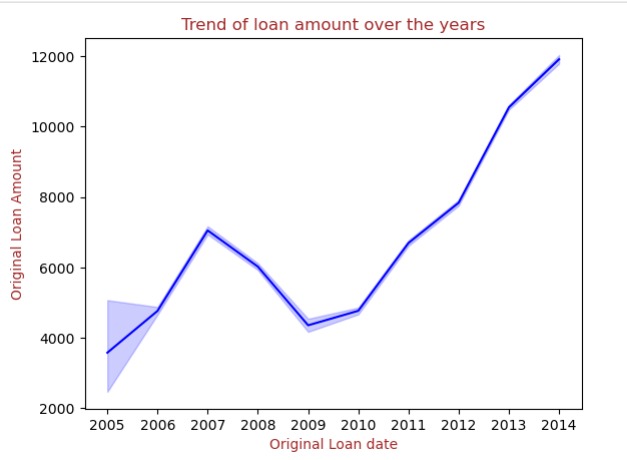
Python: Analysis of Loan Activity by ProsperMortagage Firm
We would be reviewing some of the indices that reflect the performance of Prosper mortgage firm, and the activities of borrowers.
We would be coming up with some insights that have the potential of infleuencing future financial activities.
Thanks for your engagement as we move through this audit together

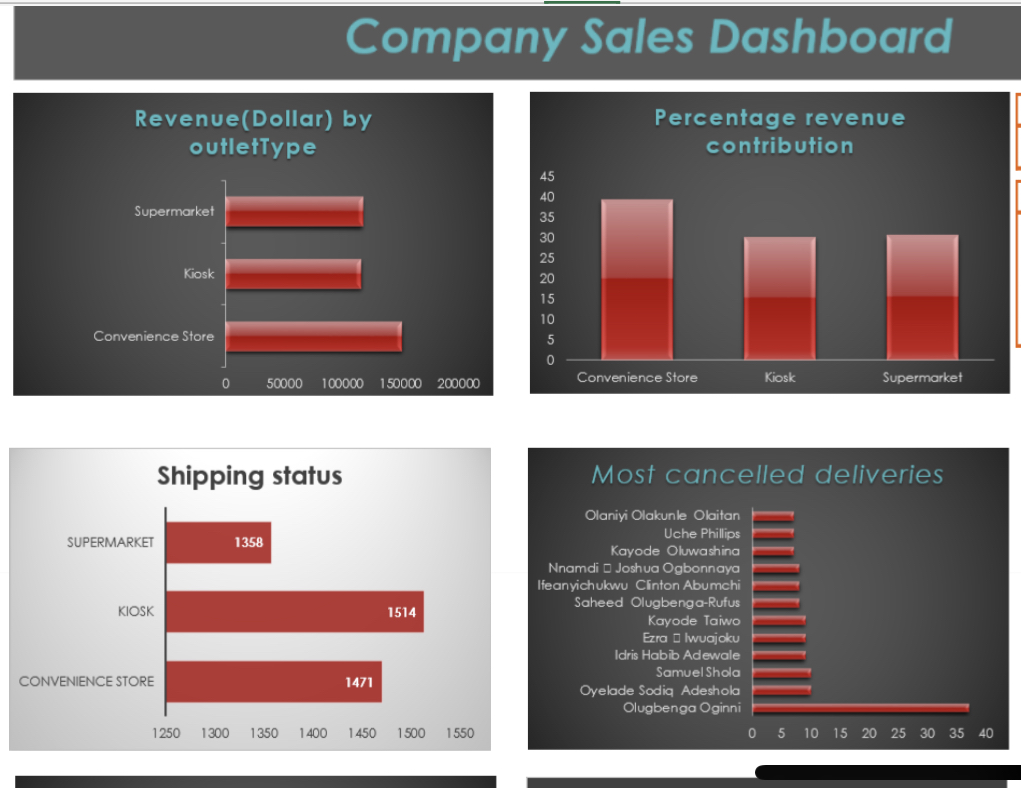
Excel: Company Sales Dashboard
This takes us to a sample of an Excel dashboard,which I created during the Lighthall.co bootcamp

PowerBI: Tata Online Sales Dashboard
This is a PowerBI dashboard I created using the dataset for Tata online sales, showing information/insights that would be helpful in guiding future sales.

PowerBI: KSM Sales Dashboard
This is a PowerBI dashboard I created using the KSM sales dataset,which was shared during the Lighthall.co bootcamp. Enjoy the insightful charts

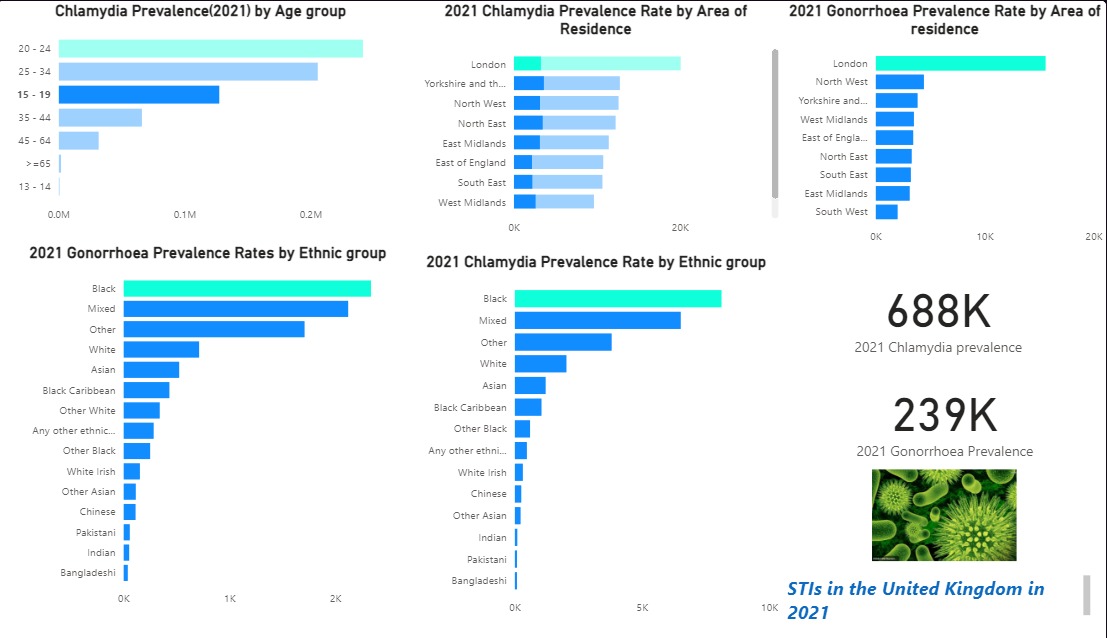
PowerBI: Sexually Transmitted Diseases in the UK
In this visual/dashboard, I was able to represent some statistical data regarding the prevalence and transmission rates of common STIs,in the United Kingdom. Dataset is from gov.uk

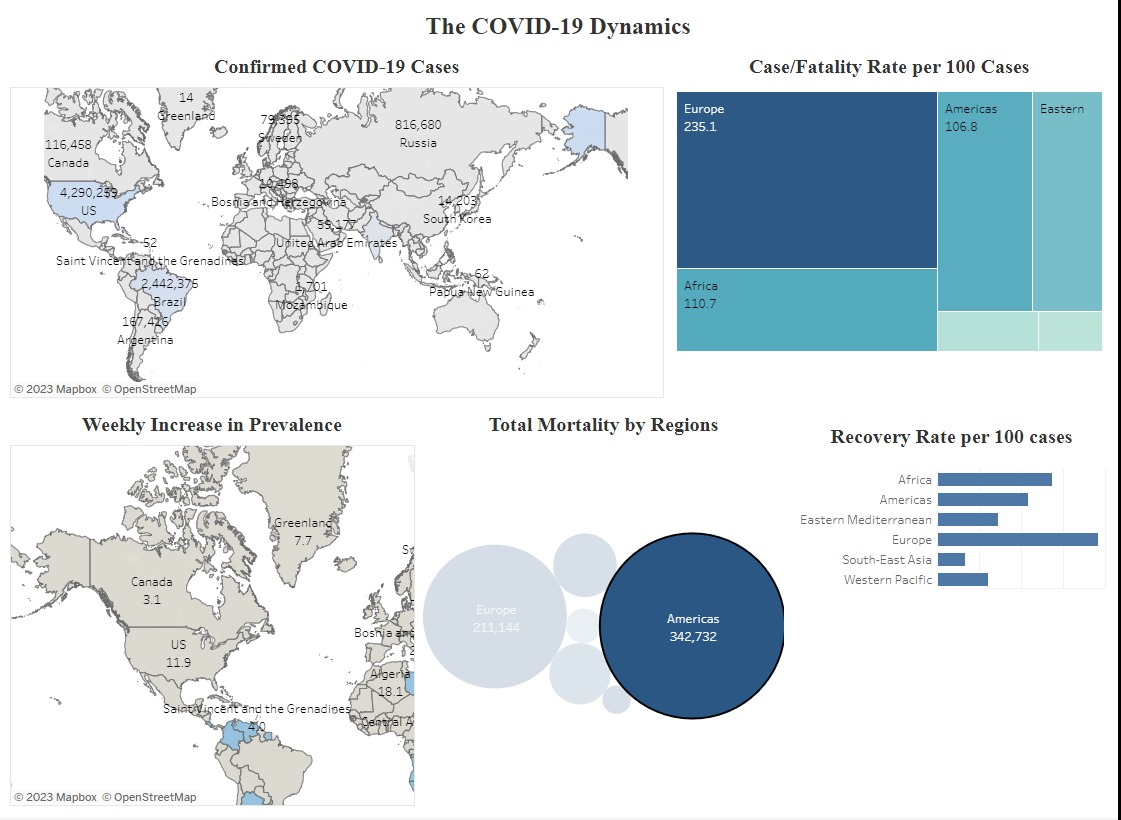
Tableau Public: COVID 19 Dynamics
This dashboard shows us some vital statistical indices as regards global COVID 19 burden,as contained in gov.uk

Tableau Public: Crimes within the UK
This dashboard shows us some vital statistical indices as regards crimes committed within the United Kingdom from April 2021 to March 2022,as contained in gov.uk

Tableau Public: Accenture Data Task Visualisation
This dashboard shows us indices about the most popular online content types and categories, and the dynamics over time, for Accenture company. This was one of the projects I undertook during the Lighthall.co training, and I accessed the data set from www.theforage.com


